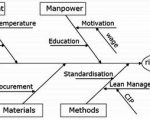
Fishbone diagrams
Ishikawa diagrams (also called fishbone diagrams, or herringbone diagrams , cause-and-effect diagrams, or Fishikawa) are causal diagrams that show the causes of a certain event — ...
Example of Pareto chart
Look at a part of your business where you have had consistency problems. An example might be customer service problems. Say you collect data on your customer complaints for April and ...
What is Pareto Chart ?
The Pareto Chart is one of the ‘Seven Basic Tools of Quality Control.’ It helps highlight the most important factors from among a group of many factors. In quality control, ...

5M model
The 5M model is a troubleshooting and risk-management model used for aviation safety.
Based on T.P. Wright’s original work on the man-machine-environment triad[3] at Cornell ...

Pareto Analysis
Vilfredo Pareto first developed the rule, or “Pareto’s Principle,” in 1895 when he discovered that 80% of the land was owned by 20% of the population. Since then, businesses ...
